This lockdown situation, while tough in many ways, has some silver linings.
I’m slowly ticking off a long list of jobs I’ve wanted to do forever (my spice drawer is very organised). And I’m also in full analysis, learning and planning mode for my business and my clients.
I thought I’d share one exercise I’ve been doing to analyse past content.
When planning a content calendar it’s important to understand what kind of content works for YOUR business. It’s not the same for every business. When you are posting content that people want to see it:
1) Gets you higher organic (free) reach so you stay top of mind.
2) Helps build brand affinity and loyalty (as opposed to posting stuff no-one cares about).
By understanding what content your audience has responded to in the past, you can improve your future content and plan with confidence.
To do this we need to group our content into rough themes (eg/ is it news and events, behind the scenes, motivational, customer stories, founder stories, new products, tips/ tricks, community news etc etc), then compare the themes by engagement rate.
Engagement rate = % How many people reached/number of engagements.
If you use a 3rd party platform such as Hootsuite or Buffer etc – you’re probably already tagging your content themes and can easily analyse in their reporting platform so you can ignore this blog post. This is for people who have been scheduling and posting using Facebooks native tool.
Warning:
This method is ever so slightly TEDIOUS but if you’re a data nerd like me it can be very enlightening. It requires you to use Excel formulas so I’ve tried to screenshot and detail the formulas for those who are not familiar.
If you want this done but can’t be bothered doing it yourself, get in touch. I suddenly seem to have all this time on my hands…….
If you’re ready to tackle it yourself, grab a cup of tea and here it is step-by-step.

Step 1. Go to Page Insights
Step 2. Export the last 6 months of POST LEVEL data.
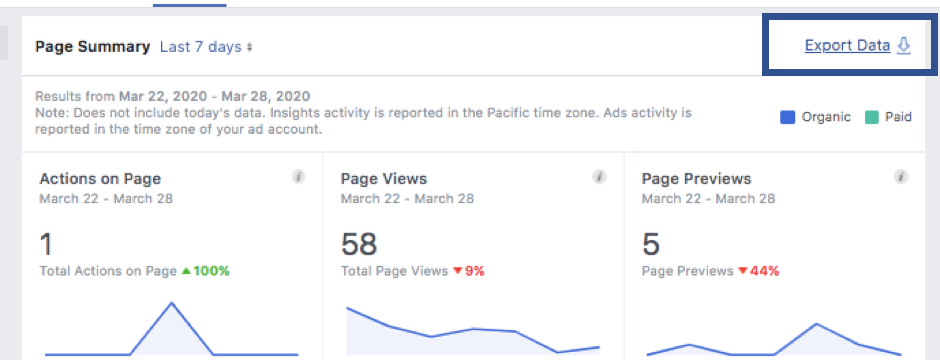
Click on export data on the overview page of Facebook insights.
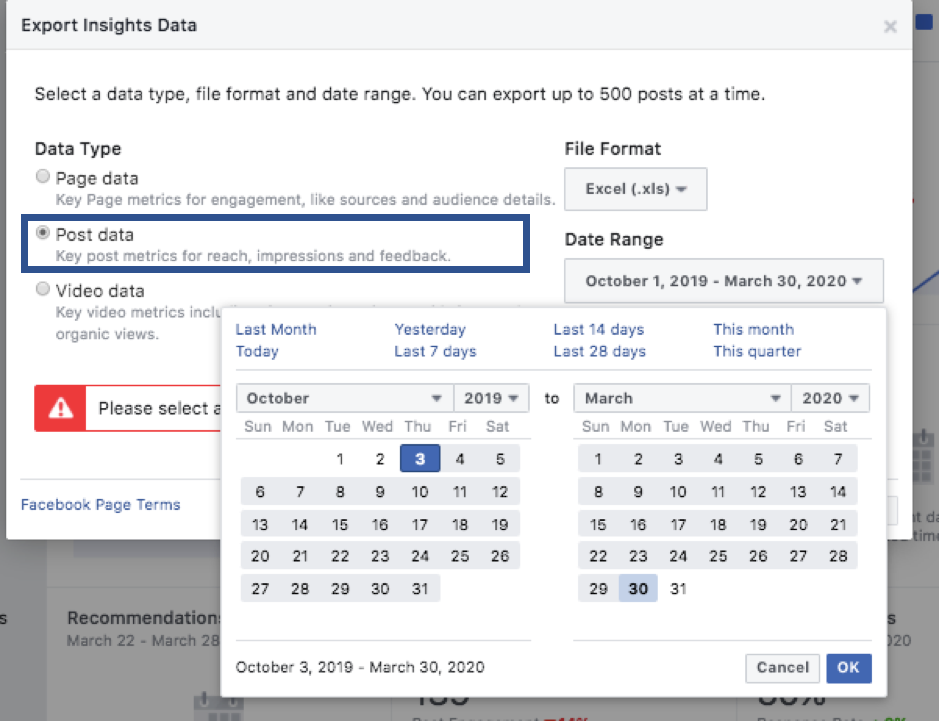
You can export up to 180 days (6 months of data).
Step 3 – Hide Unnecessary Columns
I always accuse Facebook death by data – they overwhelm people with numbers and stats that are mostly useless. This spreadsheet is a prime example of that so we’ll get rid of lots of columns and just focus on a few.

HIDE Columns A, E, F, G, H

Hide Columns J, K,L, M, N
Hide Columns J-N
So the main columns we’re going to look at are B, C, D, I, O. I & O are Total people reached divided by total engagements.
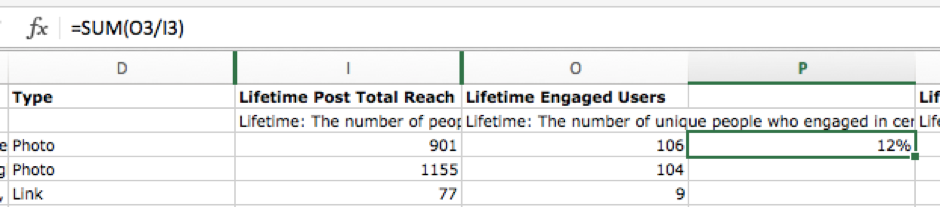
Step 4: Calculate Engagement Rate.

Engagement rate is calculated by dividing Lifetime Post Total Reach by Lifetime Engaged Users.
Insert a new column next to Engaged Users (Column O). This is where we are going to calculate our engagement rate (it will become column P).
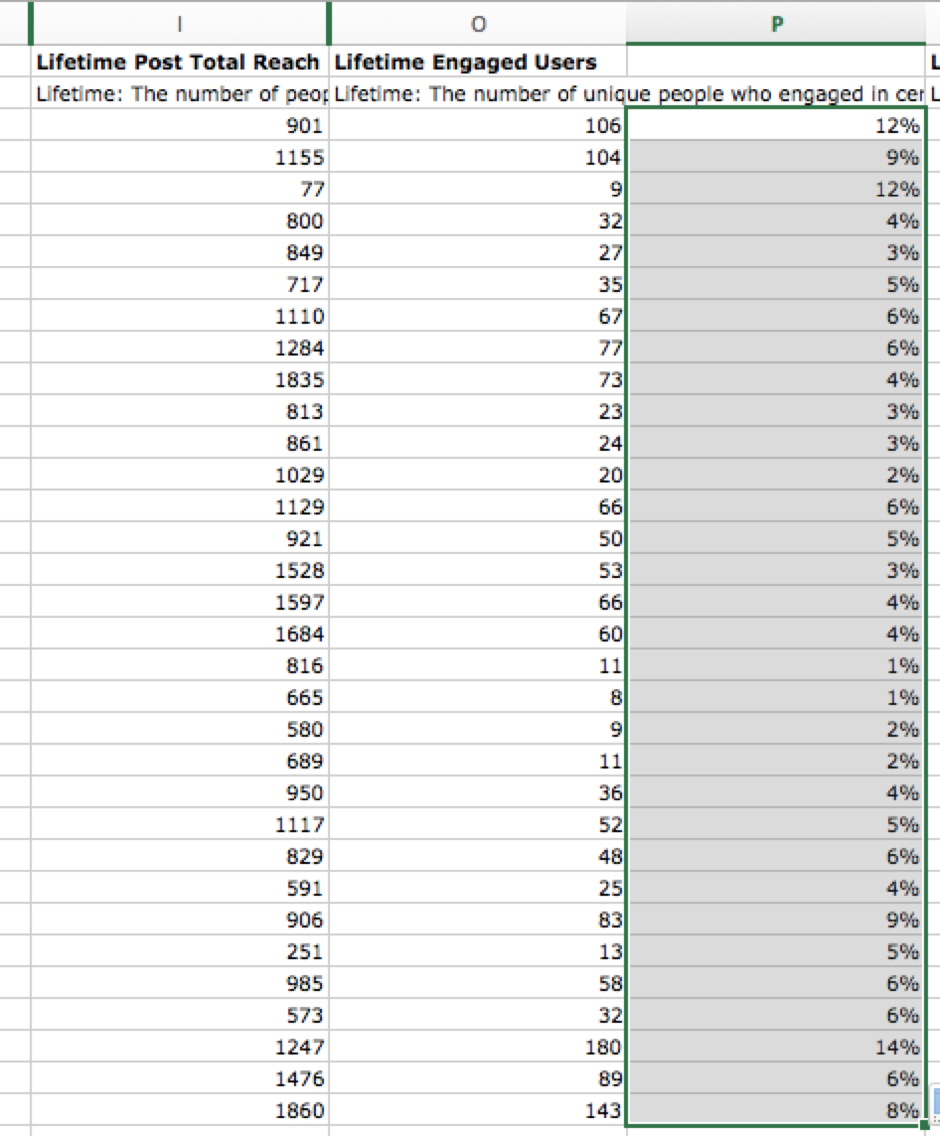
Engagement rate is calculated with the following formula. =Sum(O3/I3). Then press the % button in the top navigation bar to make it a percentage.
Then copy the formula down the whole column so each post has an engagement rate calculated ———>
Step 5. Colouring in!
This is the time-consuming bit.
Go through EACH post and assign it a colour.
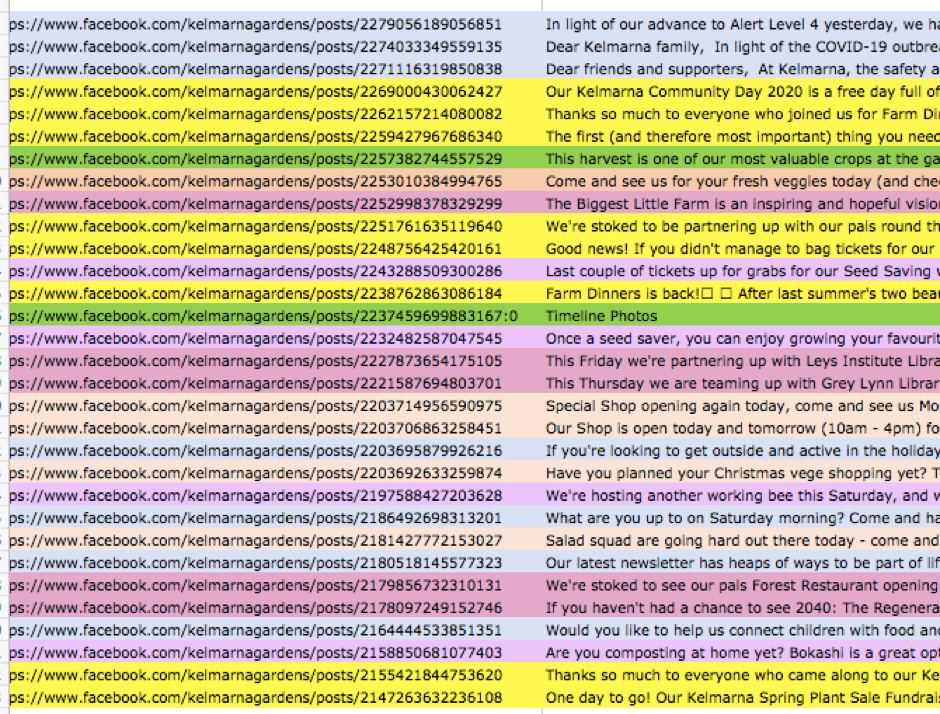
Eg/ the first two might be product related posts so you colour them blue. Then the 3rd post is a Happy Birthday to a staff member - a ‘staff post’ - so colour it pink. Etc etc. Every time you encounter a post that doesn’t fit any previous content themes, create a new colour and category. Some posts will fit into a couple of themes so just make a call on which theme it most fits in.
Remember to keep a key somewhere on your spreadsheet so you can remember what content theme each colour is!
You can either look at the copy in Column C to evaluate the post or use the live link to view the post (Column B).
Step 6: Sorting by content theme (colour)
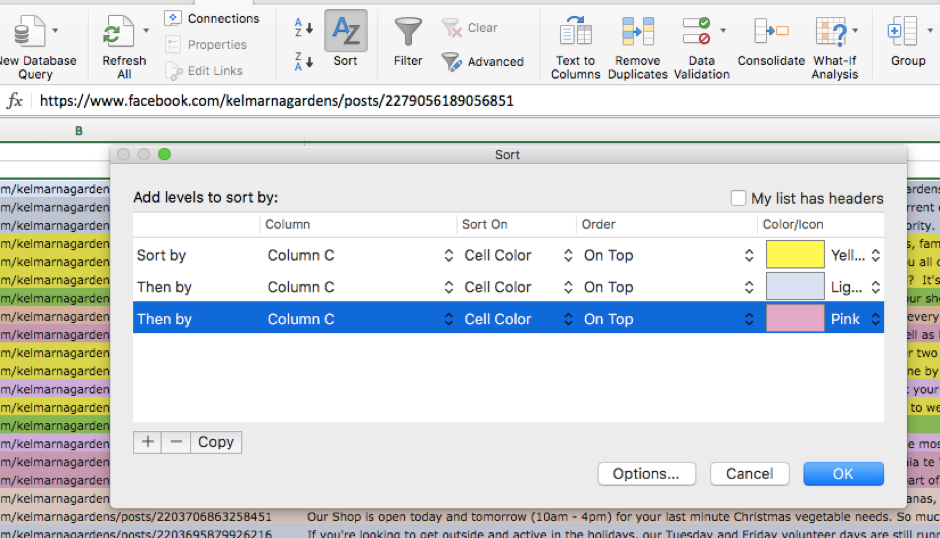
Click the sort button (top navigation bar) and choose sort Column C by Cell Colour and then choose a colour.
Press the + button (bottom left) and add a new row with a different colour until you have all the colours accounted for. Press OK.
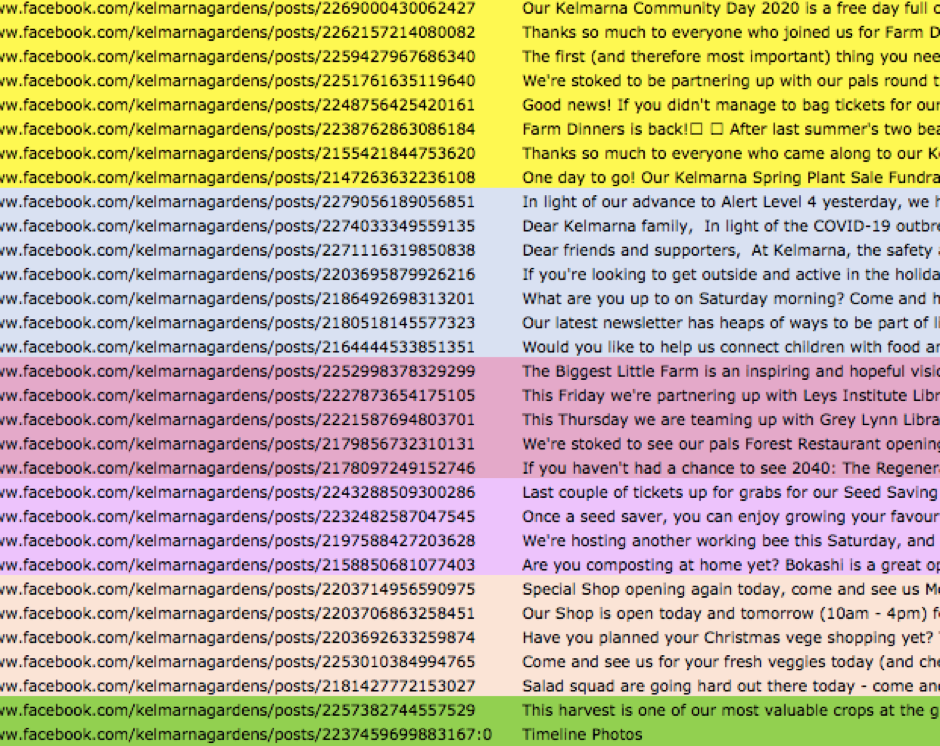
It should now look something like this!
7. Create an average engagement rate for each content theme (and rank posts within themes from best to worst).
Insert a couple of rows between each colour to give a bit of separation between themes.
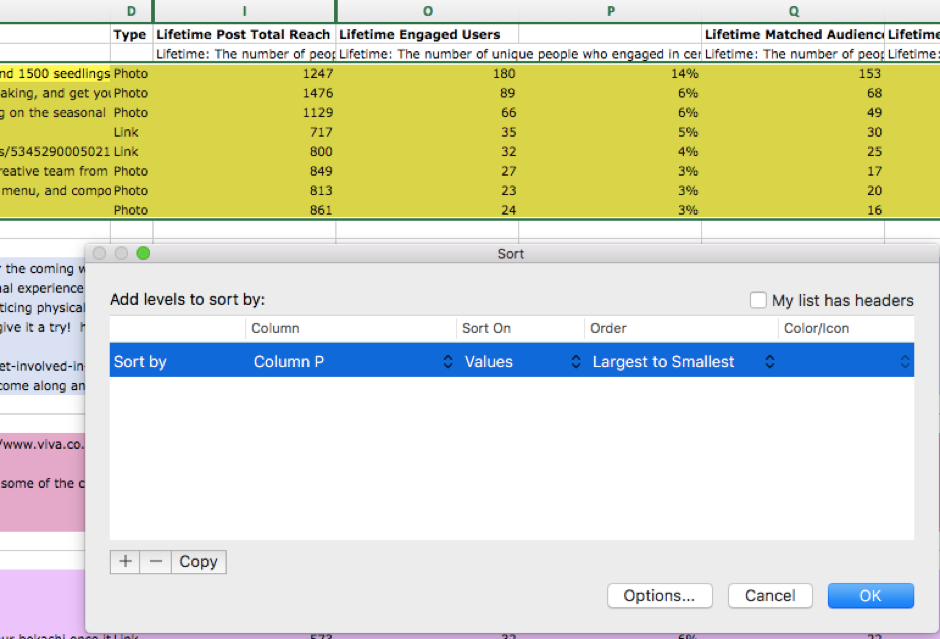
Then for EACH colour :
1. Sort that colour theme by engagement rate from highest to lowest (so you can see the best posts within each theme).
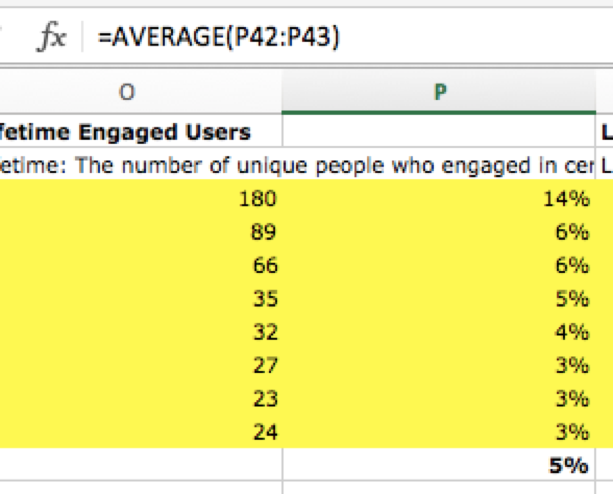
2. Create an AVERAGE engagement rate for the theme
=AVERAGE(CellNumber:CellNumber).
Now you’ll be able to see:
Which content themes overall have the highest & lowest engagement rates.
Do more of the stuff that people want to see and less of the stuff they don’t.
What are top/bottom posts overall and within each theme.
Try and spot any similarities between the top posts. Do they use emotional language? Are they behind the scenes or product lead? Do they include people in the photo or video? What time of day were the posted (you’ll have to unhide column G for that) etc.
8. Analyse other factors
The same method as explained above can be used to look at:
Formats (Column D - Type) - note with formats you’ll have to go through and some additional detail in column D as the spreadsheet doesn’t pick up things like multi-photo posts, polls or carousels.
Time of day (Column G)
Likes, comments and shares (worksheet 2 - Lifetime talking abut this).
OK that’s it, good luck!
And please comment below if you have any questions. Also would love to hear any insights you’ve found using this method.
COVID 19 update - 1:1s & $19 Webinars
During this time when most of us can’t leave the house (! - it still feels strange to say that), it’s actually the perfect time to sit back, take stock and do some planning for the (hopefully not too distant) future when life and business returns to some form of normality.
So instead of my usual in-person workshops I’m offering 1:1’s for those who want tailored help - you can read all about these here: Book an Appointment
AND soon I’ll be launching some webinars for only $19 (in honour of Covid 19). This lockdown is tough on all of our pockets so I want to offer up some of the great content I usually teach in my class at a much lower rate.
Stay tuned for info - if you’re interested follow me for updates on Facebook here, or sign up to the newsletter below. Would also love to hear what you most want to learn about so send me an email or message over on FB if you have suggestions!